Blog

us.jpg   fr.jpg

S&P 500_ Down December and S&P 500_ Worst Months Since 1928

S&P 500 Down December and Worst months Since 1928.png

S&P 500 Corrections>15% Since 2009 Low

S&P 500 Corrections>15% Since 2009.png

S&P (Total Return) Longest Consecutive Positive Calendar Year Streaks Since 1928

S&P 500 Total Returns Since 1928.png

2018_ A historically Bad Year

2018_A Historically Bad Year.png

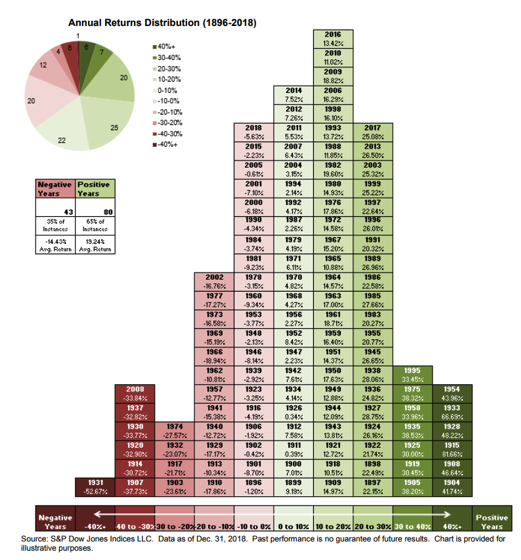
S&P 500_ Total Returns Since 1928

S&P 500 Total Returns Since 1928.png

Historical economic contractions during war or crisis (% in GDP)

01.18.png

Comparing Major World Indexes Since January 2000

Comparing Major World Indexes Since January 2000.png

Comparing Major World Indexes Since March 9, 2009

Comparing Major World Indexes Since March 9, 2009.png

World Markets in 2018 as of December 31

World Markets in 2018 as of Decemeber 31.png

The Two-Year Treasury Out-Yields S&P Dividend’s Yield

The Two-Year Treasury Out-Yields S&P Dividends' Yield .png

Syndicate content