Blog

us.jpg   fr.jpg

Realized Volatility Ranking

29.png

6M bond/equity correlation and 10 year bond yield

35.png

Average returns following negative Russell 2000 3-Year return periods vs. long-term averages (1978-2020)

28.png

U.S. debt burden likely to keep accelerating

34.png

Tax-Friendly States

27.png

Number of the top 50 stocks each year by company location

33.png

Ageing partly explains manufacturing decline (but not in the US)

26.png

Recoveries have birthed some of the world's leading companies

32.png

Recoveries have birthed some of the world's leading companies

32.png

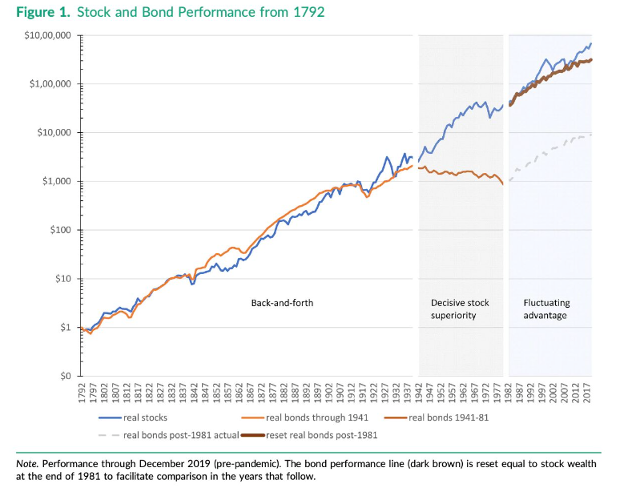
Visualizing 200 years of US Stock Market History

25.png

Syndicate content