Blog

us.jpg   fr.jpg

L'échelle des revenues de l'Observatoire des inégalités

Feb18-3.png

After-Tax Index, Median Pre-Tax, and Median After-Tax Large-Cap Core Fund Annualized vs. S&P 500

Feb18-2.png

Real 10-Year Total Returns

Feb18-1.png

The Death of Mutual Funds for Taxable Investors

Feb17-3.png

June 30 YTD Asset Class Performance & 10-Year Forecast

Feb17-2.png

Asset Class Return, Risk: Sept 2004 to June 2025

Feb17-1.png

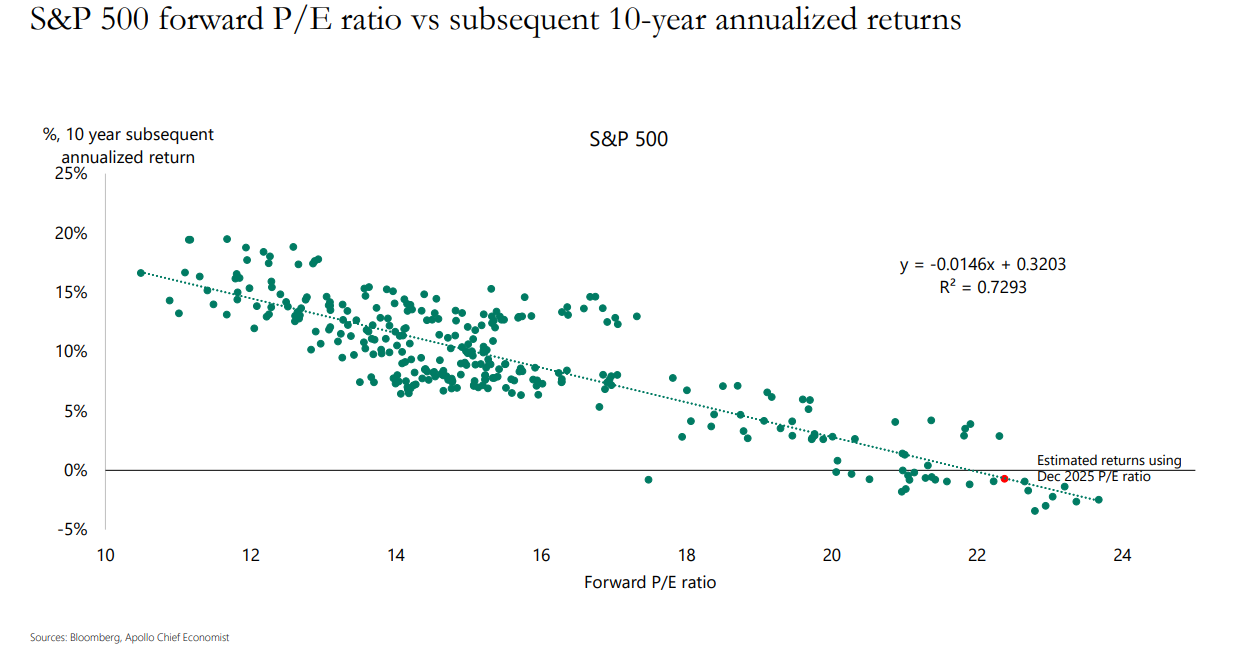
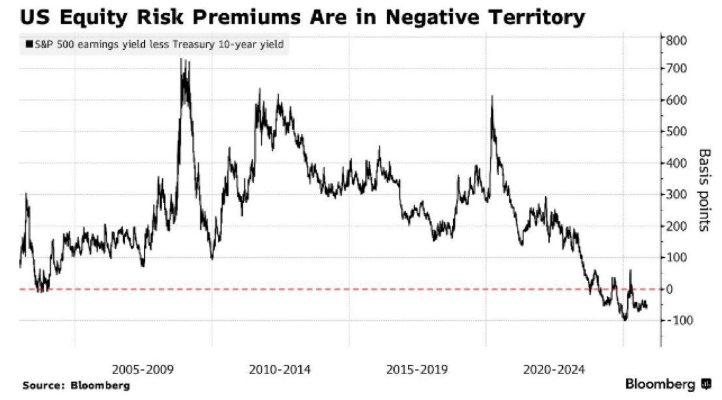
US, Non-US Stock Market Fundamentals

Feb16-3.png

U.S. federal government finances vs. total debt

Feb16-2.png

Scenario analysis by fixed income asset

Feb16-1.png

Long-Term Non-US Stock Performance Through June 2025

Feb13-3.png

Syndicate content